Cai A, Liang G, Yang W, et al. Patterns and driving factors of litter decomposition across Chinese terrestrial ecosystems[J]. Journal of Cleaner Production, 2021, 278: 123964.
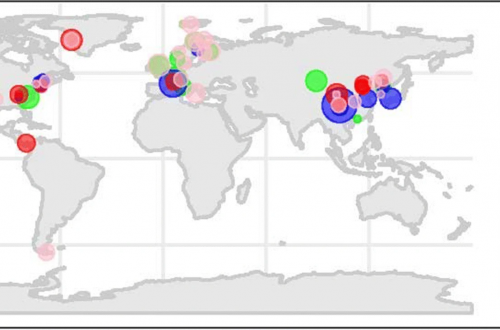
Fig. 1. Distribution of the study sites (forest: blue dots, grassland: red dots, and cropland: green dots) in Chinese terrestrial ecosystems. (For interpretation of the references to colour in this figure legend, the reader is referred to the Web version of this article.)
Fig. 2. Frequency distribution of the litter decomposition (kDD, 10−4 degree days−1) in the forest (a), grassland (b), and cropland (c) terrestrial ecosystems. The red curve is the normal distribution of the kDD. (For interpretation of the references to colour in this figure legend, the reader is referred to the Web version of this article.)
Fig. 3. Differences in the litter decomposition (kDD, 10−4 degree days−1) for different litter tissues in the forest (a), grassland (b), and cropland (c) ecosystems. The boxes show the 25% and 75% percentiles, and the lines and black dots in the boxes represent the medians and means, respectively.
Fig. 4. Maps and latitudinal patterns of the litter decomposition (kDD, 10−4 degree days−1) in all (a), forest (b), grassland (c), and cropland (d) ecosystems.
Fig. 5. Changes in the litter decomposition (kDD, 10−4 degree days−1) at different experimental durations in the forest (a), grassland (b), and cropland (c) ecosystems. The boxes show the 25% and 75% percentiles, and the lines and black dots in the boxes represent the medians and means, respectively. The blue axis scale represents the forest (a) ecosystems, and the red axis scale represents the grassland (b) and cropland (c) ecosystems. The lines and slopes come from regression equations of kDD and experimental time.
Fig. 6. The relative influence (%) of predictor variables for the boosted regression tree model of the litter decomposition (kDD, 10−4 degree days−1) in Chinese terrestrial ecosystems (a). Observed and predicted litter decomposition by the boosted regression tree model using the predictors are shown in Fig. 6b. The black line represents a 1:1 relationship. The properties are climate (mean annual temperature, MAT and precipitation, MAP), soil (sand and soil pH), and litter (nitrogen and lignin).
Fig. 7. Path analyses showed the direct and indirect effects of climate (mean annual temperature, MAT; and precipitation, MAP), soil properties (pH and sand content), and litter properties (nitrogen and lignin content) on the litter decomposition (kDD, 10−4 degree days−1) in Chinese terrestrial ecosystems (chi/df = 2.17, P = 0.14; RMSEA = 0.03). The Arabic numerals are the standardized path coefficients. The solid and dashed arrows represent the positive and negative effects in a fitted structural equation model, respectively. The line thickness indicates the strength of the effects of the variables on each other.